


Weather Data for Schools
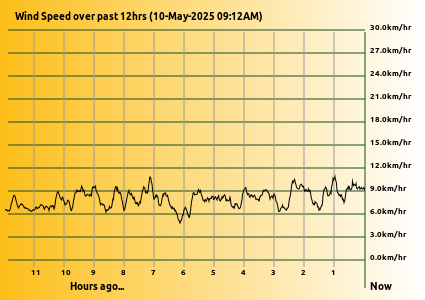
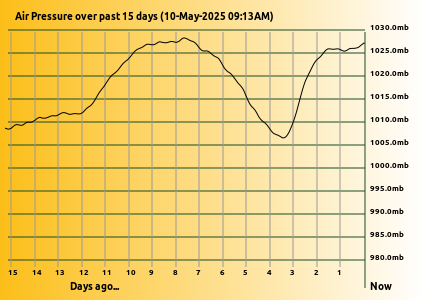
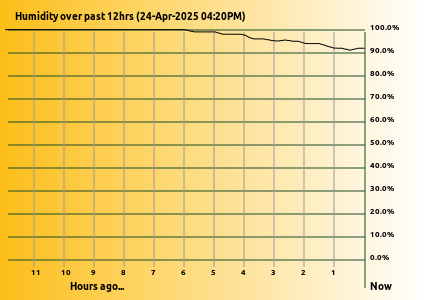
Here are the current 24/7 graphs for Air temperature, Average
Wind Speed, Air Pressure, Wind Direction, Humidity and Rainfall at Lake Tyers Beach. You
can also access the raw data that these graphs were generated from to
make your own graphs by downloading this CSV file RAWDATA. Remember to save it as a
Spreadsheet (not .csv) if you have generated graphs.Your teacher will
suggest how you can generate data from the spreadsheet file. If
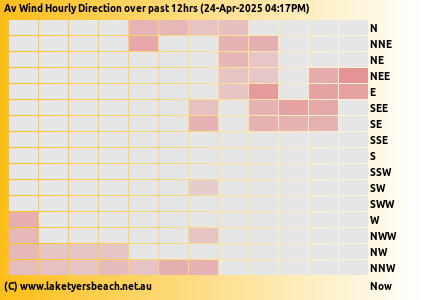
you are having trouble interpretting the wind direction graph then you
will need to look at the Wind Direction
page, and how direction averaging is achieved on the Direction Averaging page.
Schools often face the challenge from students, and especially in Mathematics of "When are we ever going to use this stuff in real life Sir (or Miss)???" This page will provide raw data and processed graphs for students to access and try spreadsheeting their own interpretations of the data. The download file, a .csv file, should load into their spreadsheets (commonly MS Excel).
The data for Temperature, Air Pressure, Wind Speed, Wind Direction and Humidity are sampled every minute. This amounts to a history of 12 hours of readings.
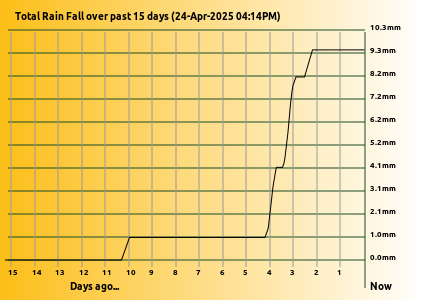
However Rainfall is sampled every 10 minutes, and reflects a duration of 15 days of readings. They are in the same spreadheet, with the same number of readings shown, but the rainfall is only added every 10 minutes instead of every 1 minute. So be careful when graphing them.
Also remember that the readings are taken in real time so it is worth revisiting the pages to see if there are other interesting patterns are happening. Make sure you left-click and copy/save any images you want to keep as they will quickly change as the day goes on. Some days will be definitely more interesting than others, so come back regularly to sample the latest data. Give them different file names.
The Wind Speed and Wind Direction need to be viewed together to get the full richness of the data, especially when significant changes in direction occurs.
The Rainfall is shown in the absolute sense of the total rainfall. The graph auto scales it so it always shows the last 15 days in high detail, rather than include the full falls since the gauge began recording. You will need to subtract the running total to see changes in detail.
There are 719 readings in each file, so feel free to investigate smaller sections if you like :-)
Some of the data, eg Local Air Pressure, Wind Speed and Wind Direction, only makes sense if you also look at the BOM Pressure Charts for all Australia. You can copy/paste the images from here as well to reinforce your interpretations.
The direction is expressed as a number from 0 to 15 where
Remember: This is what is happening at Lake Tyers Beach now, not what the Weather people on the web guess it is going to be from the Bairnsdale sensors for example.
 |
 |
 |
 |
 |
 |
| This system is a combination of Oregon Scientific Weather
sensors that have a radio link to their base console, that is
intercepted by a single board computer called an Arduino
Uno with a 433MHz receiver to intercept the weather data.
This Arduino then decodes the information and passes it a Python program that formats and
graphs the data inro images for the Apache WWW
Server and this broadcasts the resulting web pages out to you. |
The sensors are located on the
roof of my house at Lake Tyers Beach for Wind Speed and Direction, on the garage roof for
Rainfall and on the back fence, in the shade for the
Temperature. The Humidity and Air Pressure are sampled inside the
garage which very well ventilated to the outside conditions (just ask the cats!). This is a robust and very cost effective way to record the weather and share it with the rest of the world. Enjoy! |
Schools often face the challenge from students, and especially in Mathematics of "When are we ever going to use this stuff in real life Sir (or Miss)???" This page will provide raw data and processed graphs for students to access and try spreadsheeting their own interpretations of the data. The download file, a .csv file, should load into their spreadsheets (commonly MS Excel).
The data for Temperature, Air Pressure, Wind Speed, Wind Direction and Humidity are sampled every minute. This amounts to a history of 12 hours of readings.
However Rainfall is sampled every 10 minutes, and reflects a duration of 15 days of readings. They are in the same spreadheet, with the same number of readings shown, but the rainfall is only added every 10 minutes instead of every 1 minute. So be careful when graphing them.
Also remember that the readings are taken in real time so it is worth revisiting the pages to see if there are other interesting patterns are happening. Make sure you left-click and copy/save any images you want to keep as they will quickly change as the day goes on. Some days will be definitely more interesting than others, so come back regularly to sample the latest data. Give them different file names.
The Wind Speed and Wind Direction need to be viewed together to get the full richness of the data, especially when significant changes in direction occurs.
The Rainfall is shown in the absolute sense of the total rainfall. The graph auto scales it so it always shows the last 15 days in high detail, rather than include the full falls since the gauge began recording. You will need to subtract the running total to see changes in detail.
There are 719 readings in each file, so feel free to investigate smaller sections if you like :-)
Some of the data, eg Local Air Pressure, Wind Speed and Wind Direction, only makes sense if you also look at the BOM Pressure Charts for all Australia. You can copy/paste the images from here as well to reinforce your interpretations.
The direction is expressed as a number from 0 to 15 where
| 0 |
1 |
2 |
3 |
4 |
5 |
6 |
7 |
8 |
9 |
10 |
11 |
12 |
13 |
14 |
15 |
| N |
NNE |
NE |
NEE |
E |
SEE |
SE |
SSE |
S |
SSW |
SW |
SWW |
W |
NWW |
NW |
NNW |
Remember: This is what is happening at Lake Tyers Beach now, not what the Weather people on the web guess it is going to be from the Bairnsdale sensors for example.