Experimental
Rainfall
Recording
Hi Folks,
I am going to try to produce an ongoing graph of the daily rainfall, over the next few years. I have been thinking of this for quite a while and think I have a workable solution for my size of operation. I need to combine accuracy, with robust data collection and storage. To this end I am collecting the daily incremental rainfall readings from my rain gauge in a way that I can graph them and also add in the reading of the water level gauge at Number 2 Ramp.
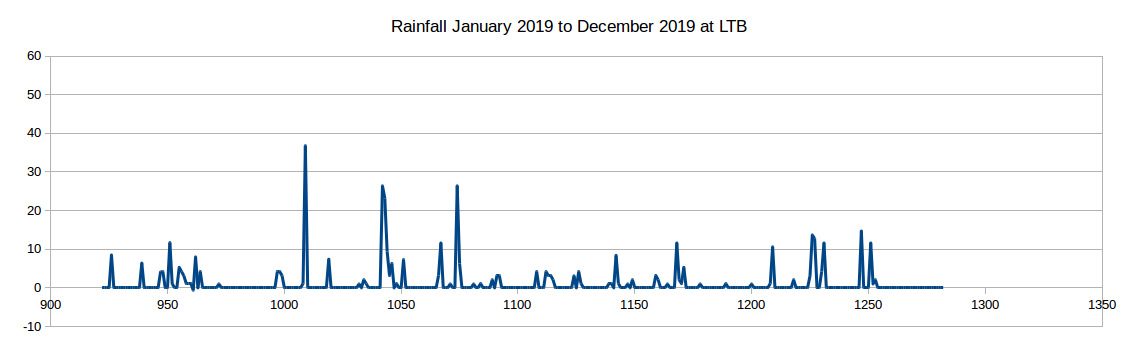
The observation I would make from these graphs is
that the last quarter of 2019 was particularly dry. In 2017 and 2018 we
had significantly more rain in October to December. In 2019 we had much
drier conditions and fed the Bushfires of 2019-2020.
That second half of the year rainfall has been declining steadily since the last time the lake opened in mid 2016 when record began to be kept. This is particularly important as it is what leads in to the summer fire season. Remarkably the amount of rain per year is almost the same. So it is not so much the total rain, but the shift from rain in Autumn to reduction in Spring, which unfortunately precedes our dry season. Sadly I don't have any data for a year that has filled the lake to capacity with an opening (plenty of photos!) for comparison. I hope to get one of those sooner rather than later.
| Six Monthly Accumulated Rainfall
figures for Lake Tyers Beach Jun2016, to Dec 2019 |
||
| Jun 2016 to Dec 2016 = 327.2mm |
||
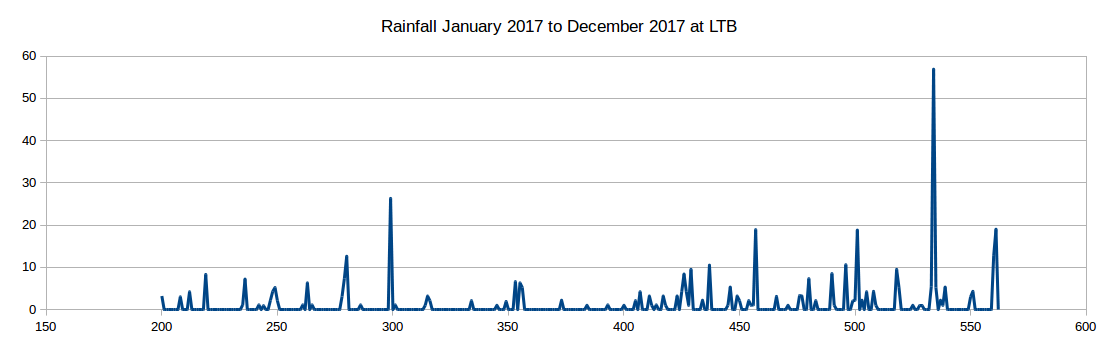
| Jan 2017 to Jun 2017 = 131.4mm | Jul 2017 to Dec 2017 = 304.4mm | Total 2017 = 435mm |
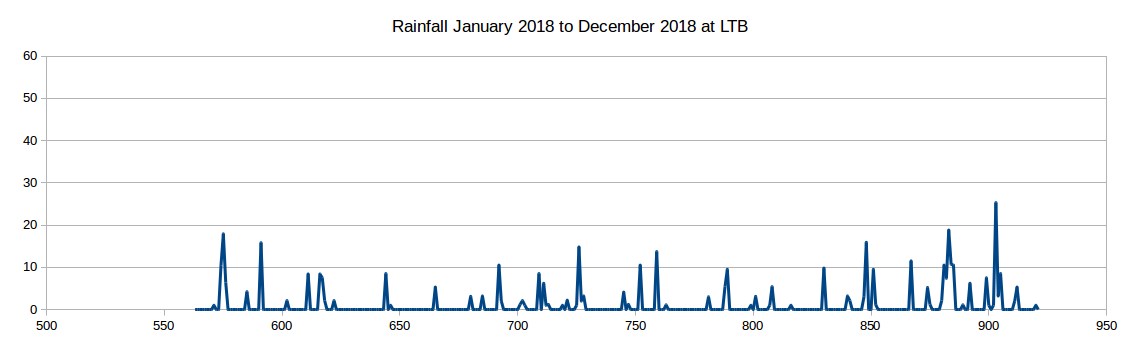
| Jan 2018 to Jun 2018 = 165.4mm | Jul 2018 to Dec 2018 = 244.6mm | Total 2018 = 439mm |
| Jan 2019 to Jul 2019 = 261.3mm | Jul 2019 to Dec 2019 = 158.0mm | Total 2019 = 419mm |
That second half of the year rainfall has been declining steadily since the last time the lake opened in mid 2016 when record began to be kept. This is particularly important as it is what leads in to the summer fire season. Remarkably the amount of rain per year is almost the same. So it is not so much the total rain, but the shift from rain in Autumn to reduction in Spring, which unfortunately precedes our dry season. Sadly I don't have any data for a year that has filled the lake to capacity with an opening (plenty of photos!) for comparison. I hope to get one of those sooner rather than later.
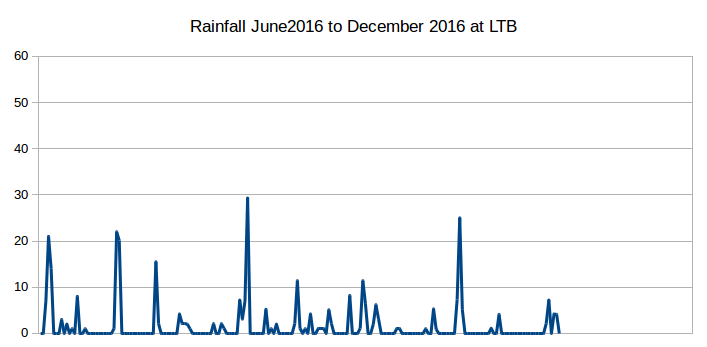
Recording was begun in June 2016, and records daily falls since then.
Most of the rain is in the second half of the year.
Rain about evenly balanced across mid year
Rain is mainly in first half of the year.
A more fanciful idea..........
I am also hoping to be able to record the temperature of the lake water at this gauge as well to be able to present that in a graph. This is the trickier reading. As we all know water is constantly leveling across the whole lake, a 10cm jump at the gauge goes across the whole lake. However I am expecting that taking the temperature at Number 2 Boat Ramp will be a somewhat isolated reading and may not be at all representative of the whole lake. My assumption is based on the fact that the lake is made of two arms, Toorloo Arm and Nowa Nowa Arm that gradually get shallower as the tributary entry points are reached. The fish move around seasonally depending on whether they are spawning or not, just to give one example of their life cycle effecting distribution. Many people are sure this is related to temperature.
It will be rewarding to investigate the temperature variation further and do some samples up the arms and determine what the distribution of temperatures might be. Spawning may be more related to shallow water and the feed available for fry in those areas. Anthropomorphism is very hard to shake off, and we must always be on our guard to avoid quick assumptions on what would suit us humans e.g. warmth means comfort!
Back to what is more easily automatically measured......
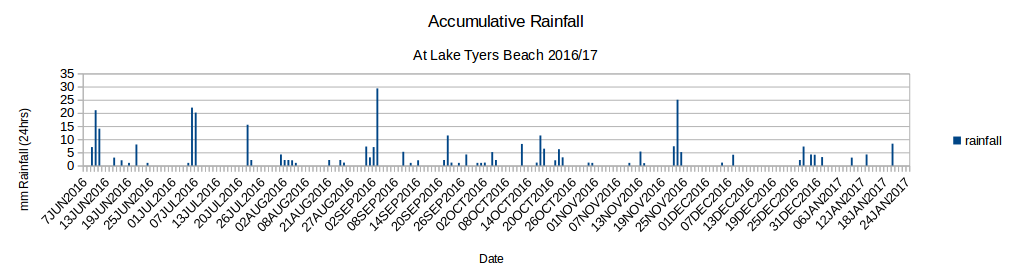
Here is the Rainfall data file (at least 3.5yrs of daily data) if you are interested rainfall.csv
And here is the beginning of the chart which for the moment will be updated manually, from time to time.
An update on the rainfall measurements as of 19/4/2019-

As you might agree we have had reasonably regular
rainfall but few storms that have really made a difference. The last one
that nearly made it to 70mm over a couple of days was early December
2017. We have a had a few close 40mm's but mostly were around the 10mm
to 15mm. The chance of filling the lake without a considerable storm is
very unlikely as recent rains have barely been keeping up with
evaporation.
Here is a previous analysis from Nov 2017.
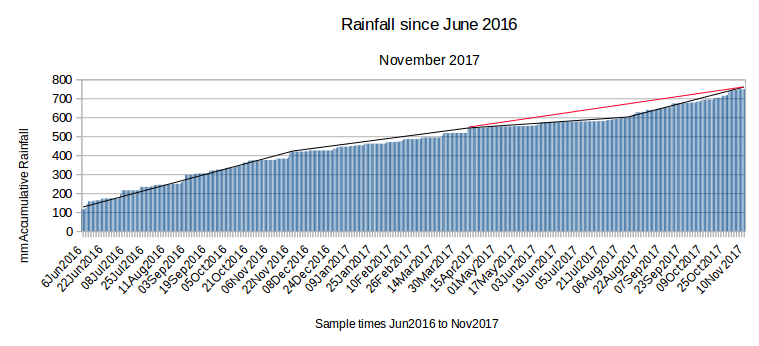
The above graph highlights that we have had a
taper off of the rain over winter this year. However Spring rains have
compensated this and the overall rainfall looks fairly average after
all. Significant for the opening is we have not had the Winter storms
of last year with a big rush of rainfall over a short period of time to
fill the lake quickly and make a break in the sandbar. The black line
hi-lights the dip over late Autumn/Winter and the red line hi-lights the
good falls we have had in late Winter and Spring. Generally speaking the
2016/17 Summer rainfall pattern continued through the 2017 Winter.