


Graphs read: Left (12 hours ago) to Right (Now)
AIR
TEMPERATURE (over 12 hrs)") |
|||||||||
WIND SPEED (over 12 hrs)") Wind speed now auto scales to allow more dynamic range of speeds to be rendered in more detail when required. |
|||||||||
WIND DIRECTION
(over 12 hrs) An original graphical representation of wind direction and strength. Each set of vertical blocks is an hour of activity (ago). |
|||||||||
HUMIDITY (over
12 hrs)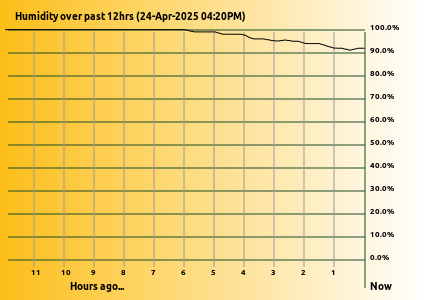 Main bush-fire danger indicator, around or below 30% means look out!! |
|||||||||
AIR PRESSURE (over 15 days) ") Thanks Andrew for suggesting the above 15 day format. RAIN FALL (over 15 days)  The air pressure and rainfall are the exceptions to the other graphs above, as they need a little longer time span to make for interesting viewing. Rainfall Experiments
|
|||||||||